
User Interface for Automated Driving
Research: How to balance information related to system trust and comfort in non-driving related tasks?
Miglani, A., Diels, C., Terken, J.B.M. (2016). Compatibility between Trust and Non Driving Related Tasks in UI Design for Highly and Fully Automated Driving. Proceedings of the 8th International Conference on Automotive User Interfaces and Interactive Vehicular Applications, 2016 [Link]
Diels, C., Erol, T., Kukova, M., Wasser, J., Payre, W., Miglani, A., Mansfield, N., Hodder, S., Bos, J. (2017). Designing for Comfort in Shared and Automated Vehicles (SAV): a Conceptual Framework. Proceedings of the 1st International Conference on Product Comfort, 2017 [Link]
Tools used: KANZI automotive, Smarteye Pro eye tracking solutions, STISIM Drive, SPSS, MAPPS
TASK
-
Build a research framework for major human factors issues pertaining to highly and fully automated driving
-
Identify the research problem
-
Develop research questions, hypothesis and experiment procedure to answer the research questions
-
Design and develop the experiment by using the user testing facilities
-
Conduct user testing/experiment to check the research hypothesis
-
Analyze the experiment results using descriptive and inferential statistical methods
-
Suggest design guidelines and recommendations for HMI designers
FRAMEWORKS
By performing a literature review, a framework was built considering the major human factors issues related to highly and fully automated driving and design guidelines to solve those issues.
The framework targeted the comfort of the passenger (no longer driver for SAE Levels 4 and 5).
It was hypothesised that while acknowledging differences between aviation and road transport, the highly and fully automated car passenger comfort will increasingly become analogous to airline passenger comfort.
The passenger comfort factors for aircrafts (Ahmadpour et al.) were extrapolated to automated vehicles.


Together, trust and comfort in NDRT covers the first five passenger comfort factors as proposed by Ahmadpour et al. Hence, for the research, focus was made on Trust in the system and Comfort in doing non-driving related tasks (NDRT).
From the comfort model it was observed that, comfort in doing NDRT is related to not just pleasure and satisfaction factors of the comfort model, but also to proxemics and physical wellbeing factors. Furthermore, Trust is related mainly to peace of mind.
Due to inter-dependency between various factors/concerns of comfort model, a research model was made by compiling all factors (from comfort model) which could influence trust in the system or comfort in doing NDRT.
Based on the factors derived in the research model for Trust in the system and Comfort in doing Non-Driving Related Tasks (NDRT) and Display Design principles by Wickens et al., a technical review for the user interface designs by different OEMs was done.
For trust in the system, brand reputation was not considered as it is a non-contributing factor towards the user interface design.
Similarly, for comfort in doing NDRT, seat ergonomics and physical layout of controls were not considered.
Also, only visual elements of the user interface were evaluated and the review was restricted to the availability of the pictures found on internet.
The review included: Tesla Model S, Volvo XC90 Drive me, Mercedes S class Saloon Distronic Plus (with steering assist), ValeoMobius, BMW Traffic Jam Assist, Nvidia Deep Learning, GM-Cadillac CT6 Sedan Super Cruise and Audi Piloted Driving.

With respect to first review i.e. checking the presence of research model factors in the user interface elements and the second review i.e. checking the quality of presence of those factors (with respect to best practices derived from comparing with Wickens display design principles), Valeo Mobius concept was a clear winner.
A point worth mentioning was the reliability of the review exercise results was susceptible to response bias.
Also, no inter-rater reliability test was conducted because the primary purpose of technical review exercise was to gain some design inspiration by finding best practices used in the existing UI concepts (proposed by different OEMs).

Review 2.0 - With Wickens display design principles

Review 1.0 - With research framework
Review 2.0 - With Wickens display design principles
USER INTERFACE REVIEW
RESEARCH PROBLEM
While the reviews were being conducted, some ‘value tensions’ were noticed.
In general, User Interfaces like Valeo Mobius concept and Volvo XC90 Drive Me have used a bird’s eye view, which acts as the transparency factor between the automated system and passenger.
Also, many user interfaces like Volvo XC90 Drive Me use a dedicated display for presenting non-driving related tasks (NDRT).
Security

versus
Autonomy
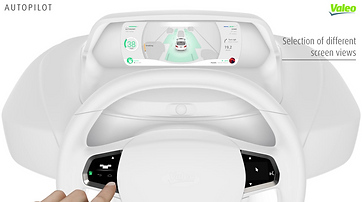
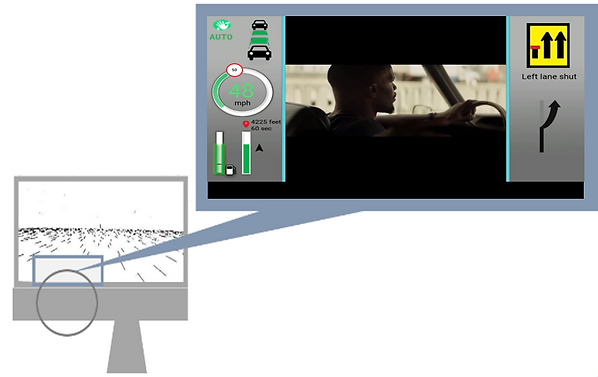
Valeo Mobius UI concept has used an ‘ambient display’ i.e. the main task (NDRT in automated mode) remains in the central area of the display screen with peripheral information (in left and right area) showing vehicle information (current mode, speedometer) and navigation information (next action, time/distance left).
In automated mode, to check the bird’s eye view, the NDRT mode has to be changed to bird’s eye view mode. This change in mode leads to reduction in autonomy to enhance security i.e. reduction in pleasure to do NDRT to enhance trust in the system.

Security & Competency
versus
Autonomy
Using a head down display for displaying NDRT, contributes to motion sickness. No doubt, using a dedicated head down display screen for NDRT would enhance autonomy of the user (more space for NDRT), but it would also reduce competency of the user (motion sickness). Further, trust information (security) is presented on instrument cluster which is on a different screen as the NDRT.

RESEARCH QUESTIONS
Which information (what?) is most important and is required by the user at all times (when?)
Also, the location of the information is critical to remove the value tensions (where?)
With respect to the research model developed, a potential trade-off between system trust and the ability to comfortably engage in NDRT is hypothesized.
That is, providing information via the UI to develop, calibrate, and maintain trust may interfere (if excessive information is provided) with the ability to comfortably engage in NDRT leading to annoyance (less disturbance factor not fulfilled), frustration, and an overall compromised user experience.
Answering the questions related to ‘when’ and ‘where’ i.e. frequency and location of the information presented could help in removing the value tensions (research problem) and hence, user acceptance of the automated technology could be achieved.
Knowing the answers to these questions i.e. knowing the relative importance of each system trust factor, would also help UI designers further by providing them solutions to customization problems.
Having different customization options, not only enhances trust but also improve user/passenger comfort (through proxemics factor of comfort model).
The customization options/modes could also help in development of Adaptive HMI.
RESEARCH QUESTIONS
1. What information should be provided by the UI to support passengers’ latent needs and concerns regarding the capability and reliability of the system?
2. When and where should this information be delivered such that both passengers’ ability to comfortably engage in non-driving related tasks (NDRT) and system trust is maintained?
3. How does the prioritization of trust versus NDRT in the UI design affect the user experience and system acceptance?
USER INTERFACE (UI) CONFIGURATIONS
From the final results obtained in the technical review, the Valeo Mobius UI concept was scaled further from SAE Level 3 to SAE Level 4 and 5.
The scaling was done considering the best practices obtained in second technical review and the research questions to be answered.
Three user interface concepts/configurations were designed – Baseline/Control configuration (concept A), Head-up/High mounted display configuration (concept B), Distributed Display configuration (concept C).
The UI concepts configuration were different in the extent to which they prioritized trust versus NDRT.
To narrow down the scope of the research, only SAE Level 5 UI configurations are considered for the research.
However, for highly automated driving i.e. SAE Level 4, same configurations would hold true with the addition of system confidence level information and duration of automated mode information (on high mounted display screen).
The UI Concepts only differ in the presentation of system transparency related information i.e. why and how a system is performing an action.
The variation in transparency level information also varies the ‘no disturbance’ factor and NDRT space (of comfort in doing NDRT) of the research model.
Other factors influencing either system trust or comfort in doing NDRT were kept constant to neglect the effects of other factors (of research model) on answering the research questions.
Furthermore, factors not contributing towards UI design were neglected.
Thus, trust factors: System knowledge and practice, Brand Reputation and comfort in doing NDRT factors: Seat ergonomics, physical layout of controls and motion sickness (avoid vibrations around 0.16 Hz) were not covered. System Knowledge and experience (System Trust factors) were covered in the experiment design though.
The NDRTs of interest here were display based and watching a video (how it is made) was considered for the research.

+ System confidence level information
=
+ Duration of automated mode information

SAE Level 5 automation
(Fully automated driving)
SAE Level 4 automation
(Highly automated driving)

High mounted display (HMD) elements
1280 x 800 (landscape orientation)

Central console (CC) elements
1920 x 1080 (portrait orientation)
Auditory notifications (same for all configurations)
Female British voice : Anthropomorphism factor
Driving you to your destination in 3, 2, 1 : Drive starts
You have reached your destination : Drive ends

Concept A :
Baseline configuration
No trust information related to 'why and how the system is performing any action'
Concept B : High mounted display configuration
The information (why and how the system is performing any action) would appear some time ahead of the event on a vertical bar (on high mounted display) sliding in from the right.

Concept C : Distributed display
configuration
The information (why and how the system is performing any action) would instead be presented on the central console and at all times thereby leaving NDRT space uncompromised.
EXPERIMENT DESIGN

Independent Variables: Configurations A, B, C
Dependent Variables: System trust and Comfort in doing NDRT
Triangulation Variables: Emotions (valence, arousal), Eye glances, Workload, User experience metrics (usefulness, usability)
Other variables: Subjective preference, Dispositional attributes (Trust before experiencing the system), willingness to engage in NDRT

EXPERIMENT DEVELOPMENT


. . .
EXPERIMENT RESULTS
Demographics data was collected first including:
Gender distribution, Distribution across age, Distribution across departments/study majors, Driving experience, License type, Driving simulator experience, Automated driving experience
> No participant experienced any simulator sickness and all 30 participants completed the entire study.
Dispositional attributes measured were Mean Trust in fully automated driving system (after system theory and before the experiment) and Willingness or desire to engage in a non-driving related task (NDRT).
To test trust scale (before experiment) reliability, Cronbach’s alpha was calculated (scale having 12 items, used by 30 participants). The value of Cronbach’s alpha came out to be 0.867 (value greater than 0.7) and hence, no item was dropped out of the questionnaire.
QUANTITATIVE DATA RESULTS
 |  |
|---|---|
 |  |
 |  |
 |  |
 |  |
 |  |
QUALITATIVE DATA RESULTS
 Subjective preference [1-Baseline, 2- HUD, 3-Distributed display] |  Affinity diagram - Information needs |
|---|---|
 Affinity diagram - Distributed display configuration |  Affinity diagram - Head up display configuration |
 Affinity diagram - Baseline configuration |
CORRELATIONS
 Correlation table - Distributed display configuration |  Correlation table - HUD configuration |
|---|---|
 Correlation table - baseline configuration |
EYE GAZE TRACKING RESULTS
 Areas of interest |  Baseline configuration heat map |
|---|---|
 Distributed display configuration heat map |  Head up display configuration heat map |
DESIGN GUIDELINES
Based on the experiment results and participants' feedback, some guidelines were framed and customisation options were suggested:
-
Head up display should be used to display NDRT and it should be ensured that steering wheel does not hinder HUD display screen
-
Deliver important trust information (transparency, predictability) through attention capturing cues
-
Consider customization options and evolution of trust with experience while designing adaptive UI
-
It should be ensured that there is not any graphics update lag in the UI elements behaviour
-
Trust information being delivered through attention capturing cues should be glancable
-
Future UI may benefit from increased use of text as opposed to icons and symbols
-
HMI should be configurable to suit individual needs
-
Trust information should not be presented in users’ visual periphery and if displayed, there should not be any ‘constant’ movements or sharp visual contrast changes outside users’ foveal vision