
Enriching music listening experience for bicyclists
Qualitative Research: How can music listening experience be enhanced for bicyclists?
Group Size : 2
Tools used: Affinity diagrams, questionnaires, Storyply, Diary study, Contextual Enquiry
TASK
-
Develop a focused research question and a design goal
-
Evaluate user needs
-
Translate the user needs to a concept design
RESEARCH QUESTION & DESIGN GOAL
-
To understand the level of awareness of bicyclists and factors affecting their awareness while they are listening to music and bicycling
-
To design a music tool which would enhance user’s (bicyclist’s) awareness of the environment while bicycling and listening to music
RESEARCH METHOD
Three methods mainly: Cultural Probe, Diary Study and Contextual Inquiry were compared to evaluate user needs and answer the research questions.
Diary study was opted to conduct user research.
The main reason for opting diary study for user research was because the goal was to collect data on how users/bicyclists are using a specific product or service in their natural environments. In this case, it was believed that a dairy study would be an appropriate fit, as it will help further to understand the users’ behavior and formed habits with the product.
It was also believed that it would be difficult to be with the user/bicyclist and observe, interview him/her, while he/she is bicycling which could have even lead to impact on the user's safety.
Another important reason to opt for diary study was to understand the context in which the product was used because the research question was related to awareness of the environment.
As a dairy study can be focused on the environment/context over a period of time, it was possible to apply for this study.
The dairy study offered a great solution in order to collect the data as ‘fresh’ after the event.
PILOT STUDY - SETUP
A pilot study was done to explore and discover the context in which we are doing our research and to get an overall feeling of how to apply a dairy study.
In this initial study, 3 students (age group: 18-26, all male) were asked to fill in a form after they made a trip with their bicycle while listening to music.
The reason students were chosen to fill up the form was because of the fact that many students are habitual users of the bicycle and listen to music while they are bicycling. Also, they are quite often familiar with the trip, which makes them less aware of their surroundings (according to our initial hypothesis).
DIARY DESIGN
For the pilot study, 4 different elements were shortlisted and it was believed that these 4 elements would help further to get to the core of research questions and would be directly linked with our design goal:
1. Bicycle
2. Environment
3. Music
4. Music tool
A form was drafted based on diary study method and consisting of 21 questions, also covering the elements mentioned. Apart from the questions based on the four elements mentioned above, some questions were introduction questions which were asked to know about the background of the user. For the same reason, a user consent statement was included in the form. Also, some questions were asked such that any answer given by the users for questions related to the 4 elements, could be verified and triangulated by these extra questions.
An attempt was further made to make the form user-friendly by asking users simple questions, adding pictures as options to answers and some inspirational questions like, “do you enjoy listening to music while biking?”.
It was anticipated that the results would share some light on factors like the familiarity of the journey, the perception vs actual awareness, habits and context/environment.
ITERATION IN STUDY
As volunteers only filled in the dairy form once, the data collected was too less and non-significant to understand the habits and natural behavior of the user.
It was noticed that the answers of the users to the questions became shorter towards the end of the form indicating that the users probably became less involved. This could have been because of the length of the diary (21 questions).
It was realized later that the focus should have been more on identifying users’ needs and not attacking the problem first.
Many aspects of the pilot study were based on assumptions. It was realized that to make a concrete conclusion focus should be more towards identifying the users’ needs and behavior and not on self-made assumptions.
Also, some questions were closed questions, the answers of which could not provide any hint towards the users' needs.
For the final study, 9 volunteers (age group: 18-26, 5 Male, 4 Female) were asked to fill in a form
The amount of questions were decreased from 21 questions to 6 questions. The six questions designed were now more open questions and were more focused on getting useful data about users’ needs and behavior.
The users were asked to fill in our form every single time they made a journey with the bicycle over a time period of 3 days.
The form of the study was also changed from a paper form to a digital form which could be filled in entirely using a computer/phone. This was done mainly due to time management and because more users had to be approached during this study.
FINAL RESULTS
On an average, 3 filled in forms were received per participant, indicating 3 trips made by them while bicycling and listening to music
An affinity diagram was used to emphasize our main findings and to divide the answers over different sub aspects of the research question. The diagram was made using Google drawings, while having team discussion online


Influencing factors:
-
Visual field of the bicyclist,
-
Attention resources availability,
-
Music volume,
-
Method to change songs,
-
Other applications' notifications,
-
Device working status, trip timings (day/night),
-
User health status while listening to music,
-
Tasks (to be) performed before (after) the trip,
-
Nature of immediate surroundings,
-
Weather condition
Neglecting any external factors (like weather) and problems associated with the music devices, it was found that there exists a value tension between independence and security. The bicyclists try to prevent any accident by scanning the environment (security). But while doing so, they are focused towards the environment and not towards listening and 'enjoying' the music (lack of independence).
It was hard to find the balance between the actual awareness and the perception of the participants. This is something where more time could have spent by defining certain questions in the dairy study which would emphasize this important aspect of the case.
Another aspect which would have been beneficial in the validation of our study would be to have the participants fill in even more forms over a longer period of time. By this way, better understanding could have developed towards recurring habits.
If there was enough time, the diary media could have been paper instead of digital. Participants would probably find it less of a burden to fill in the paper form and it might have made them feel more personal towards the diary ( A ‘dairy’ feeling, as stated by one of the participants).
FROM RESEARCH TO DESIGN
After attending a Storyply method workshop, the user research results were translated to envision meaningful concepts.
The research question was framed in a different manner such that it relates to a title for experience. The title for experience included listening to music freely without being anxious about safety while biking.
Different relationships were sought between the basic human needs and the data received. This was done by listing down the motivations (enjoying music) and points of tension (being aware while cycling).
A clash between Security and Autonomy i.e. neither of the two exists together was evident. This clash between autonomy and security lead to reduction in competence. This is because
they wanted to enjoy listening to music (competency) without focusing much on the
surroundings. But, tensions like more traffic noise, problems associated with their music
device and earphones did not let them.
Concerning relatedness, we found that the type and loudness of the music and weather had
a close connection with their emotional expression.
An experience story was set up with help of a framework, which included People (characters), Objects (props) and Places (settings). The story was framed to include all the tension points (from the data received), such that a worst case scenario could be imagined, which further lead to developing a story.
STORYPLY WORKSHOP


Billy (main character) is done with his work at the university and is heading home with his friend Bob. Billy has an assignment due for next day (time pressure), so he wishes to be home as early as possible. Bob is constantly annoying Billy by talking to him and not letting him listen to music (Autonomy reduction). Also, it starts to rain and Billy is annoyed even further. It was rush hour and traffic was all around. Being annoyed by his friend Bob, he raises volume by taking his phone out of his pocket (trying to take control -competency). While doing so, his earphones fell off from one of his ears. Doing all these adjustments, he skipped a traffic light and got hit by a car, Max was driving (security reduction). Billy realized he should have paid more attention towards the traffic.
CONCEPTS ENVISIONED


= BiWARE
+
BIcyclist aWAREness
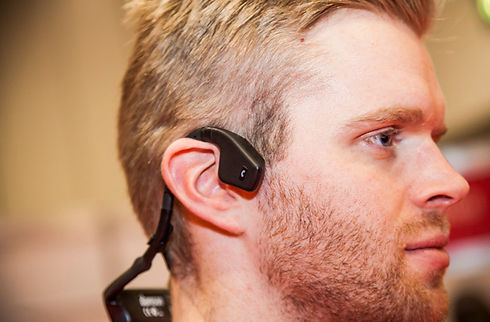
Bone conduction technology
Enjoy music (autonomy) while not being disconnected from the outside world (security) and be more aware of the traffic
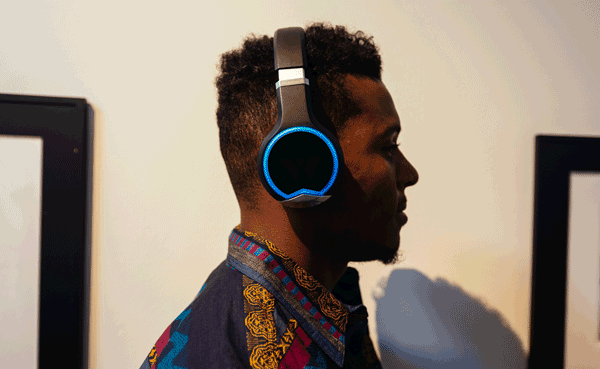
HINDICATE
Headphone INDICATors
Others know you are listening to music and are careful while passing/ driving near you
Smart Maps
Recognize crossroads and traffic lights
Spotify on the go
Create bicycling playlist
Adaptive Volume
A connected smartphone application which senses the attention paying points from Smart maps, sends signals to Spotify on the go to lower the volume and after passing these check points, again sends the signal to turn back to original volume. All you need to do is fill up your daily routine.
* Preference testing is further required to validate the concepts.